When Miggo Security's research team reported a critical remote code execution vulnerability in Grafana to the vendor, the clock started. Ninety-five minutes later, Grafana Cloud was patched. For a platform used by millions of organizations worldwide, that number is remarkable. It also raises a question worth sitting with: in your environment, what triggers that clock?
What Was Found
CVE-2026-27876 is a chained vulnerability carrying a CVSS score of 9.1. It lives inside Grafana's SQL expressions feature, a capability that lets users transform query data using SQL syntax. The flaw allows an attacker with as little as Viewer-level permissions to write arbitrary files to the underlying file system, which can then be chained with other attack vectors to achieve full remote code execution and an SSH connection directly to the host server. In plain terms: a low-privilege user in a misconfigured Grafana instance could take complete control of the server it runs on.
Grafana is not a peripheral tool. It sits at the center of observability stacks, holding API keys, cloud credentials, database connections, and monitoring tokens. Compromising it doesn't just affect dashboards. It potentially hands an attacker visibility into, and access to, the broader environment.
The vulnerability affected both self-hosted Grafana instances and, prior to patching, Grafana Cloud.
How It Was Found
The vulnerability was discovered by Miggo Security's research team through runtime security analysis of a live application environment. This type of vulnerability couldn’t be detected through a static scan of source code or pre-deployment penetration test. It could only be discovered through the kind of analysis that surfaces how software actually behaves under real conditions.
This distinction matters. The SQL expressions feature is functional, legitimate, and enabled by design. A traditional security review looking at the feature in isolation might not flag it. What runtime analysis can surface is the chain: how that feature, in context, interacts with other components to create a path an attacker could walk. That is a fundamentally different class of finding.
For CISOs, this points to a gap worth examining. Most vulnerability programs are weighted toward pre-deployment controls. Runtime visibility into production application behavior remains underinvested, and that is precisely where chained, logic-based vulnerabilities like this one tend to hide.
Grafana's Response
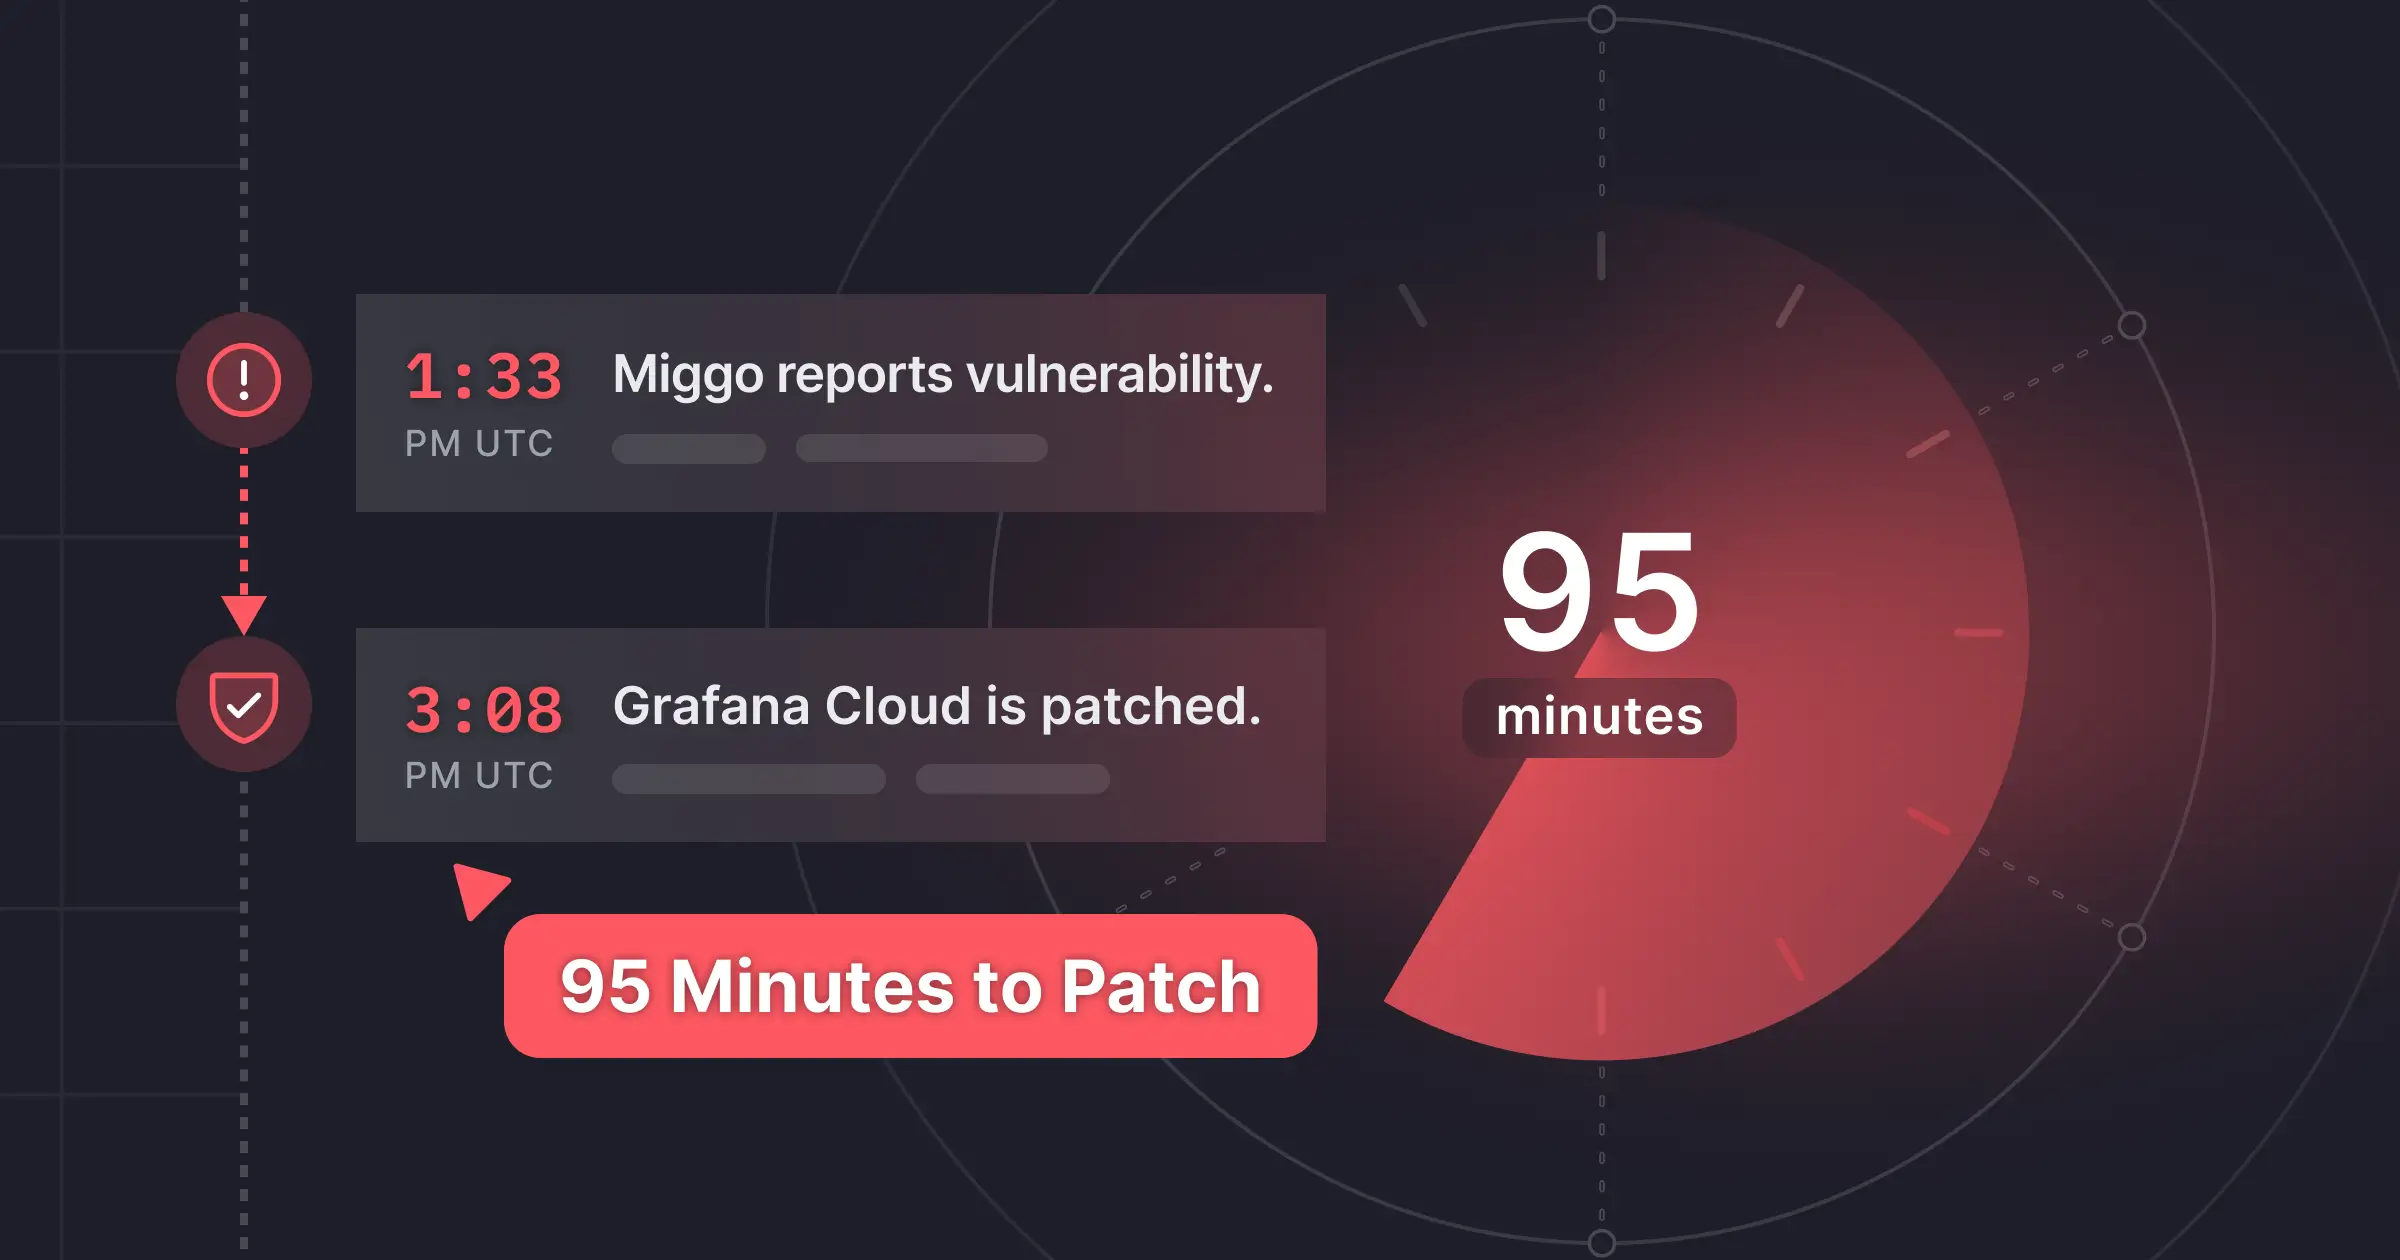
The timeline Grafana published tells its own story:
- 1:33 PM UTC: Miggo reports the vulnerability. Grafana declares an internal incident.
- 3:08 PM UTC: Grafana Cloud is patched.
Ninety-five minutes to diagnose, develop, test, and deploy a fix across a global cloud footprint for a critical vulnerability. That outcome reflects an engineering and security organization that had the processes, the tooling, and the muscle memory to move fast when it counted.
Grafana also coordinated early notification under embargo with cloud providers including Amazon Managed Grafana and Azure Managed Grafana, ensuring managed service customers were protected at the time of public disclosure. Self-hosted users received patched versions with clear remediation guidance.
This is responsible disclosure working as intended, and it sets a high bar.
What This Means for Security Leaders
Two things are worth internalizing from this incident.
First, the attack surface you are monitoring is not the same as the attack surface that exists. Grafana is an observability tool. It is the kind of infrastructure that security teams rely on to detect incidents, which makes it an attractive target and a blind spot. If your monitoring platform is compromised, your ability to detect and respond to everything else is compromised with it. Observability infrastructure belongs inside your security program, not outside it.
Second, patching speed is only one half of the equation. Grafana's 95-minute response time deserves recognition. But Grafana could not respond until someone told them there was something to respond to. The clock only started because a runtime security analysis surfaced a vulnerability that would not have been visible through conventional means. For every fast patch, there is a detection capability that made it possible. The question is whether you have that capability in your own stack.
If you are running a self-hosted Grafana instance, update to version 12.4.2 or one of the other patched releases now. Grafana Cloud and managed service customers are already protected.
Learn more about how Grafana Labs and Miggo Security are embedding security directly into observability workflows here.